The Four Layers of Agricultural Risk
How a systematic risk ranking framework turns complex farm exposure into actionable intelligence for crop insurers, lenders, and investors
When a crop insurer prices a policy, a development bank assesses a farm loan, or a commodity trader evaluates seasonal exposure, they are all asking a version of the same question: how risky is this farm? The answer they usually receive is a single number — a premium rate, a credit score, a volatility index. That number compresses four fundamentally different types of agricultural risk into one figure, losing almost all the information that would make it useful.
An agricultural risk ranking framework changes this. Instead of collapsing farm risk into a single score, it separates the sources of that risk into distinct, measurable layers — each with its own data inputs, its own trajectory over time, and its own relevance to a specific group of financial and insurance decision-makers. Understanding which layer is driving risk in a given farm, region, or portfolio is the difference between a pricing decision and a guessing exercise.
This post introduces a four-layer framework that Zetarium applies in its risk assessment tools, and explains why each layer matters — not just for crop insurers, but for every fiscal player with exposure to agricultural outcomes.
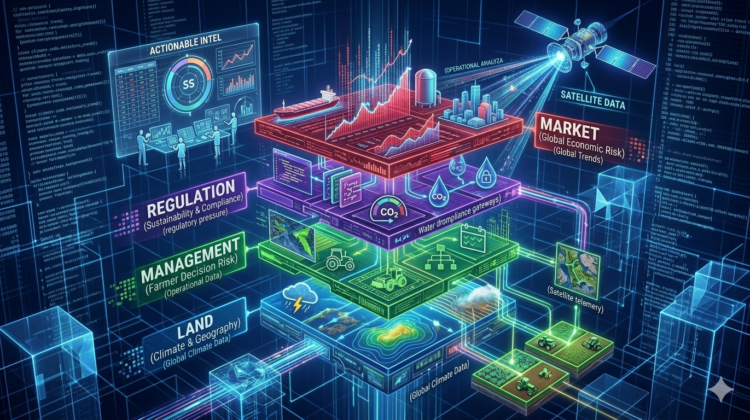
Layer 1 · The Land Layer
Ranking farms by what the land itself carries
The first and most fundamental layer of agricultural risk ranking is the risk embedded in the land itself — the combination of climate exposure, geographic characteristics, soil profile, and the natural physiological vulnerability of the crop being grown. This is the layer that changes most slowly and that can be assessed with the highest confidence. It is also, as discussed in the post on why crop insurance limits coverage, the layer that drives the overwhelming majority of insurable crop losses. Pest, disease, management error, and market failure are real risk factors — but when a field fails at scale, climate is almost always the primary cause.
Zetarium’s crop risk profiling solution directly addresses this layer by combining agroclimatic data, peril frequency modeling, and crop-specific physiological vulnerability into a location-level risk score. A wheat farm in a semi-arid region with historically high rainfall variance carries a different land-layer risk than a maize farm in an irrigated valley with stable growing-degree-day accumulation — even if both farms are managed identically and both operate under the same macroeconomic conditions. The land layer isolates that difference and quantifies it.
| Data sources | Agroclimatic records · satellite land classification · soil surveys · peril frequency models · crop phenology databases |
| Changes over | Decades — driven by long-term climate trend, not seasonal variation |
| Primary users | Crop insurers (underwriting) · reinsurers · agricultural lenders · land investment funds |
The land layer is the foundation of every other risk assessment. A farm that carries high land-layer risk will require exceptional management just to reach average outcomes.
Layer 2 · The Management Layer
Ranking farmers by how well they manage what the land gives them
The second layer is the most underestimated variable in conventional agricultural risk assessment — and the one with the most direct implications for crop insurance loss ratios. Two farms with identical land-layer risk profiles, growing the same crop in the same season, can produce dramatically different outcomes depending on the quality of the farmer’s operational decisions. As explored in the post on the agency of farmers, farmer agency is not a soft concept — it is a measurable driver of agricultural outcomes that traditional risk models have historically ignored because it was difficult to observe.
Satellite monitoring changes this entirely. By tracking field-level vegetation indices, planting date compliance, irrigation patterns, and crop recovery trajectories through successive growing seasons, it becomes possible to build an operational quality profile for individual farmers — a management layer rank that sits alongside, and partially modifies, their land layer score.
Application
This rank has two distinct dimensions that matter for insurance and investment decisions. The first is preemptive risk management: does this farmer apply risk-reducing interventions — drainage improvements, windbreaks, timely fungicide application, adjusted planting density — before a peril arrives? A farmer who consistently acts ahead of adverse conditions reduces the probability that a climate event translates into an insured loss, even when the event itself is unavoidable. The second dimension is post-event recovery management: after a damaging event, does this farmer make the decisions — replanting timing, irrigation adjustment, fertilizer reapplication — that give the crop the best possible chance of partial recovery? These two behaviors are observable from satellite imagery over multiple seasons, and they compound. A farmer who is good at both can meaningfully outperform their land-layer risk profile year after year.
A high land-layer risk farm managed by an exceptional farmer is a fundamentally different insurance risk than the same farm managed passively. The premium should reflect that difference — and with satellite data, it now can.
| Data sources | Multi-temporal satellite imagery (NDVI, EVI) · planting calendar compliance · irrigation pattern tracking · multi-season loss history |
| Changes over | Seasons — management quality can improve or deteriorate year on year |
| Primary users | Crop insurers (premium adjustment · renewal decisions) · agricultural lenders (loan performance prediction) · impact investors |
Layer 3 · The Regulation Layer
Ranking farms by incoming sustainability and compliance exposure
The third layer is the newest and, in many markets, the fastest-growing source of agricultural risk: the regulatory and sustainability pressures that are beginning to reshape what farmers are permitted to do, what markets they can access, and what financing is available to them. Unlike the land and management layers, this risk does not originate on the farm. It arrives from outside — from carbon regulation, water allocation policy, supply chain sustainability requirements, and ESG criteria applied by institutional lenders and export market buyers.
Carbon footprin
Carbon footprint risk is the most visible dimension. Livestock and feed crop sectors are already subject to emissions accounting requirements in several jurisdictions, and regulation is tightening. Farmers who rely on industrial-scale animal husbandry supply chains — growing fodder crops for intensive cattle or poultry operations — face an indirect but significant regulatory exposure: as downstream processors face carbon limits, demand for specific feed crop volumes can shift abruptly, changing the revenue basis for an entire farming operation with little warning.
Sustainable water supply
Sustainable water supply is the second dimension, and in many regions it is the more immediate risk. Climate-driven changes in precipitation patterns are increasing pressure on freshwater reservoirs that irrigated agriculture depends on. Regulatory responses — water allocation caps, seasonal abstraction limits, aquifer protection zones — are already affecting farm viability in parts of southern Europe, Central Asia, and North Africa. A farm ranked favorably on its land-layer drought profile may nonetheless carry significant regulation-layer water risk if its irrigation license is subject to allocation review.
| Data sources | Carbon accounting frameworks · water allocation registries · national ESG regulation trackers · supply chain sustainability audits |
| Changes over | Years — regulatory cycles move slower than seasons but faster than climate trends |
| Primary users | Agricultural lenders (ESG loan conditions) · impact investors · commodity traders (supply chain due diligence) · crop insurers (long-term product viability) |
Layer 4 · The Market Layer
Ranking agricultural operations by macro-economic and geopolitical exposure
The fourth layer operates at the largest scale and is the hardest to hedge against at the farm level. Market-layer risk encompasses the upstream and downstream economic forces that can undermine a farming operation regardless of how well the land performs, how skillfully the farmer manages it, and how carefully they comply with regulation. It divides into two directions: input accessibility and output demand.
Input risk
The upstream dimension — concerns the availability and cost of the materials a farmer needs to produce a crop: seed, fertilizer, fuel, machinery, crop protection products. These supply chains are increasingly interconnected at a global level, and they are correspondingly vulnerable to international disruption. The 2022 fertilizer supply shock following the conflict in Ukraine provided a clear and recent illustration: nitrogen and potash prices doubled or tripled across European and Asian agricultural markets within a single season, raising input costs for grain and oilseed farmers well beyond what their revenue projections had assumed. Farmers who could not access affordable fertilizer at the right moment in the growing calendar faced a compounding risk — reduced yield, reduced quality, and a cost base that could not be recovered from the eventual harvest price.
Demand risk
The downstream dimension — is in many respects the more severe of the two. A farmer who has invested fully in a growing season, paid all input costs, and managed their land and crop through to harvest, and then finds that the market price has collapsed due to geopolitical disruption, social unrest in the importing country, or a demand shock in the processing sector, has no path to cost recovery. The crop exists. The revenue does not. This scenario — costs fully committed, returns eliminated — represents the worst-case outcome in agricultural finance, and it is one that neither land-layer nor management-layer risk assessment can predict or prevent.
| Data sources | Commodity price indices · agricultural input cost trackers · trade flow data · geopolitical risk indices · demand forecasting models |
| Changes over | Weeks to months — the most volatile layer, least predictable at farm level |
| Primary users | Commodity traders · agricultural investment funds · development banks · crop revenue insurance designers |
Market-layer risk is the one layer that a perfectly managed farm on excellent land, in full regulatory compliance, cannot protect itself against. It is also the layer that most crop insurance products currently do not cover — which is precisely where the next generation of agricultural risk products needs to go.
From four layers to one decision: how the ranking serves every player in agricultural finance
The value of separating agricultural risk into four distinct layers is not academic. It is operational. Each layer speaks to a different audience, changes at a different speed, and calls for a different response.
- A crop insurer pricing a multi-year policy needs to weight the land layer heavily — it is the most stable signal and the strongest predictor of long-term loss frequency.
- A bank evaluating a seasonal loan needs to weight the management layer — a farmer’s operational quality is the strongest predictor of whether a given season will produce the revenue needed to service the debt.
- An impact investor evaluating a portfolio of smallholder operations needs to weight the regulation layer — the trajectory of ESG compliance requirements will shape which farms remain bankable over a five-to-ten-year horizon.
- A commodity trader hedging a futures position needs to weight the market layer — the volatility of input costs and export demand is what determines whether a contracted crop volume will actually be delivered at the agreed price.
The first three layers — land, management, and regulation — are directly measurable using the data infrastructure that Zetarium has developed for the agricultural insurance sector. This same infrastructure, originally built to serve underwriting decisions, becomes a shared data resource for every fiscal player operating in the agricultural value chain: insurers, lenders, traders, and investors can all consume the same underlying risk intelligence, interpreted through the lens of their specific decision horizon. The broader organizational argument for why this kind of integrated risk intelligence matters — and why it requires structural change inside insurance companies to deploy effectively — is laid out in the series anchor post, The Gate and the Compass.
A shared language for agricultural risk — across every layer
The agricultural sector has long suffered from a fragmentation of risk language. Insurers speak in loss ratios. Lenders speak in credit scores. Investors speak in volatility measures. Traders speak in basis risk. Each profession has developed its own vocabulary for describing what is, fundamentally, the same underlying reality: the exposure of a farming operation to forces it cannot fully control.
A four-layer agricultural risk ranking framework does not replace any of those vocabularies. It provides a common foundation beneath all of them — a structured decomposition of farm risk into components that each professional community can translate into its own terms, while remaining legible to all the others. When a crop insurer, a development bank, and a commodity trader are all looking at the same land-layer score, the same management-layer trajectory, and the same regulation-layer outlook for a farming region, they are finally speaking the same language. Portfolio decisions improve. Pricing becomes more precise. Capital flows more efficiently to the farms that can use it most productively.
That is what risk ranking, properly constructed, makes possible — not just better insurance, but a better-functioning agricultural finance system.
▸ Previous: Pricing as a Nudge: Crop insurance pricing strategy using behavioral economics and risk capacity